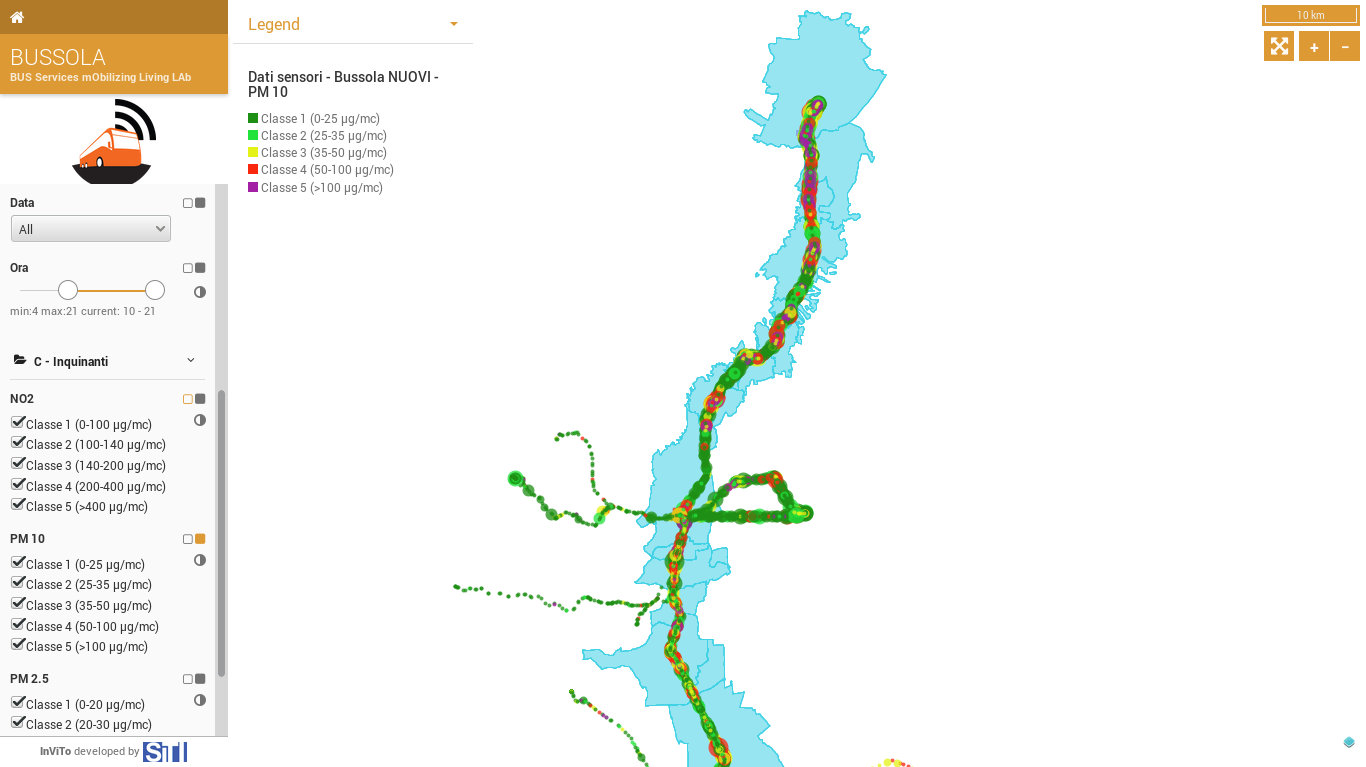
Interactive Visualization Tool
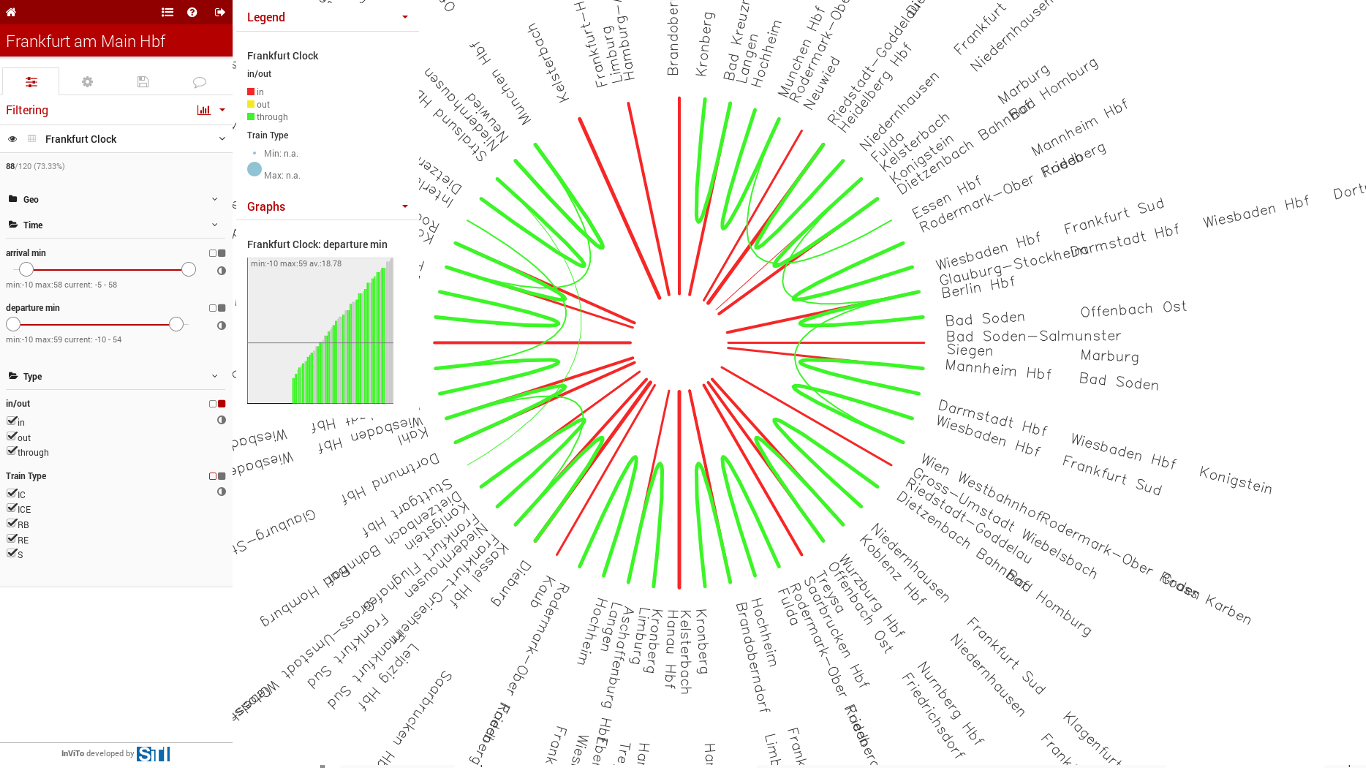
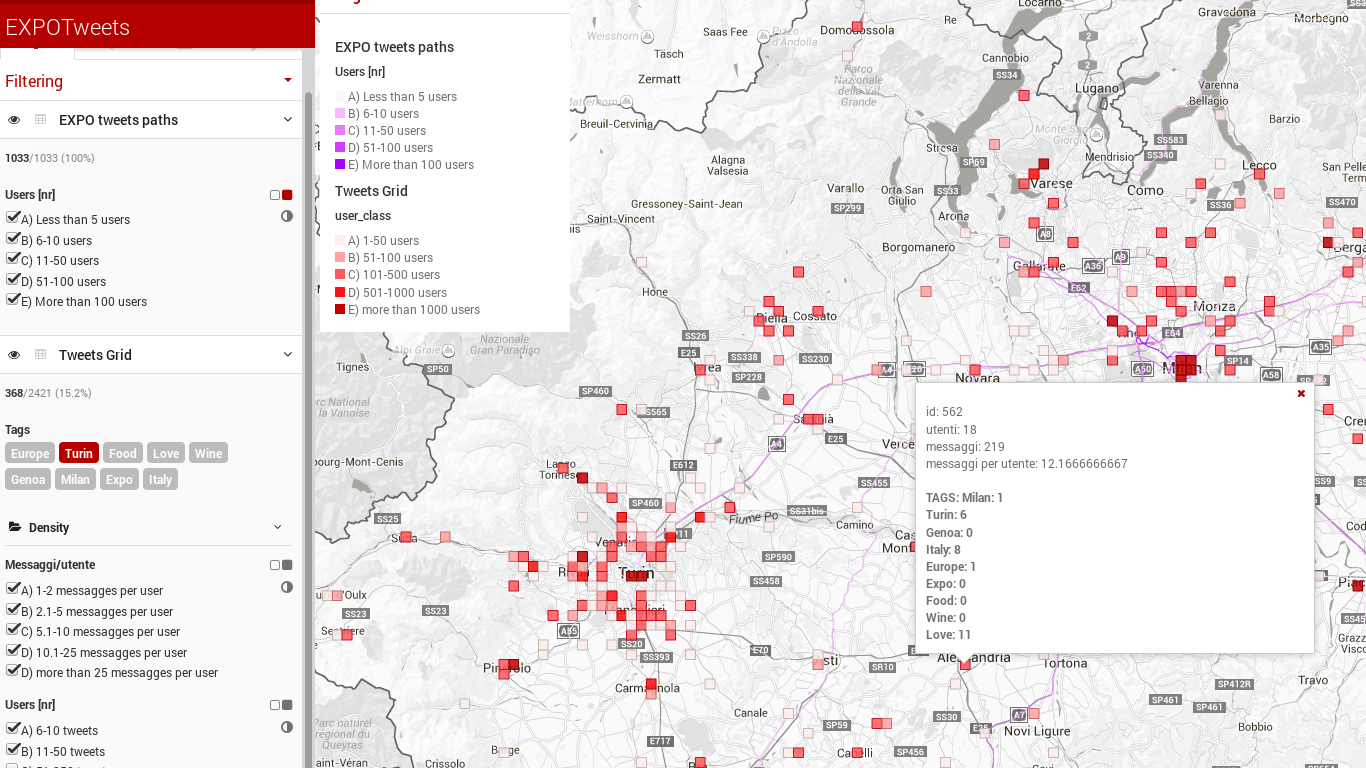
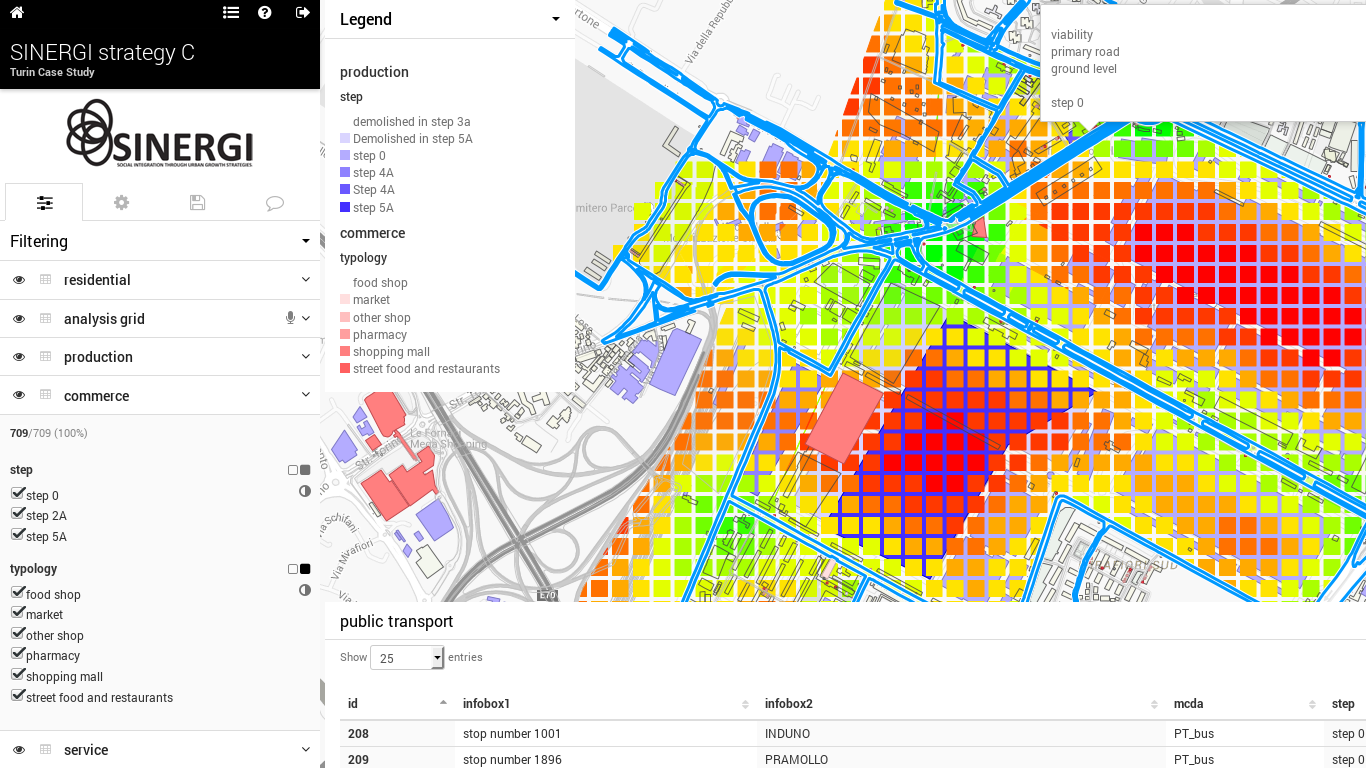
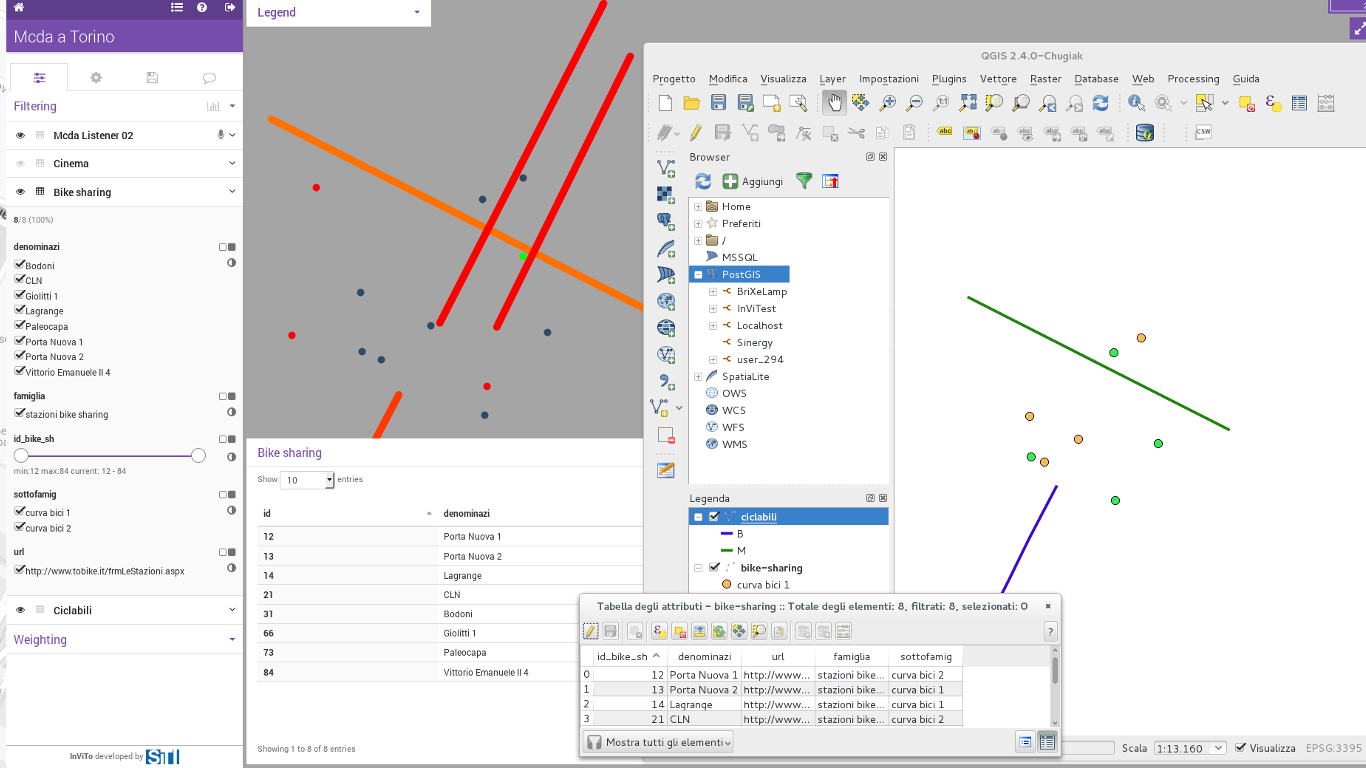
InViTo is a web gis toolbox to view, filter and make analysis on spatial data.

About InViTo
The Interactive Visualisation Tool (InViTo) is an ongoing research on Spatial Decision Support Systems (SDSS). It aims to guide users in building their spatial knowledge and awareness by means of high interaction with dynamic maps, in order to allow decision-makers to be informed before making their choices. InViTo stems out from Stefano Pensa’s PhD thesis at Politecnico di Torino, a research that has been developed in SiTI – Higher Institute on Territorial Systems for Innovation.
Learn moreDemo Projects
InviTo has been used, since 2012, in projects in different part of the world.
Thanks to the acquired experience the tool has been actively developed and refined.
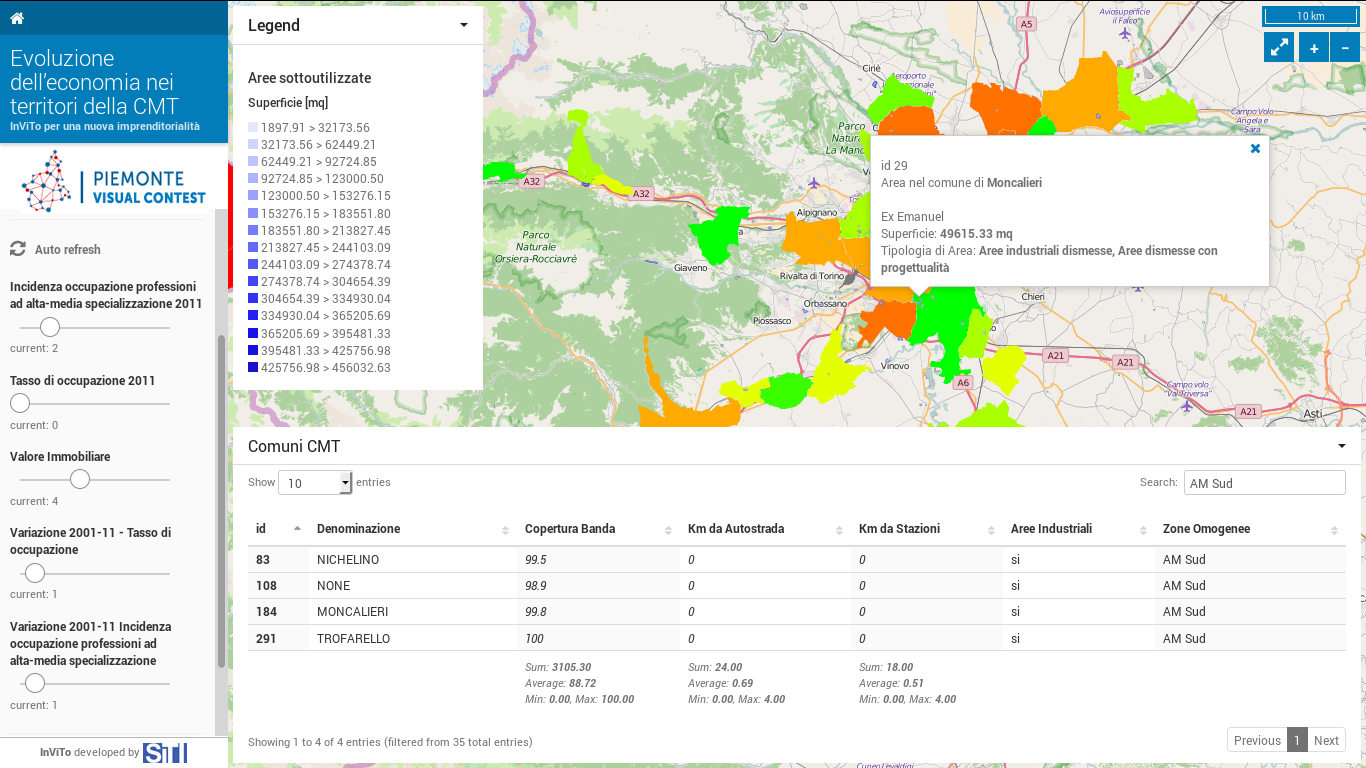
Piemonte Visual Contest 2016
This demo offer to decision makers and businessmen the ability to visualize economical, social and infrastructural data of Metropolitan City of Torino (CMT).
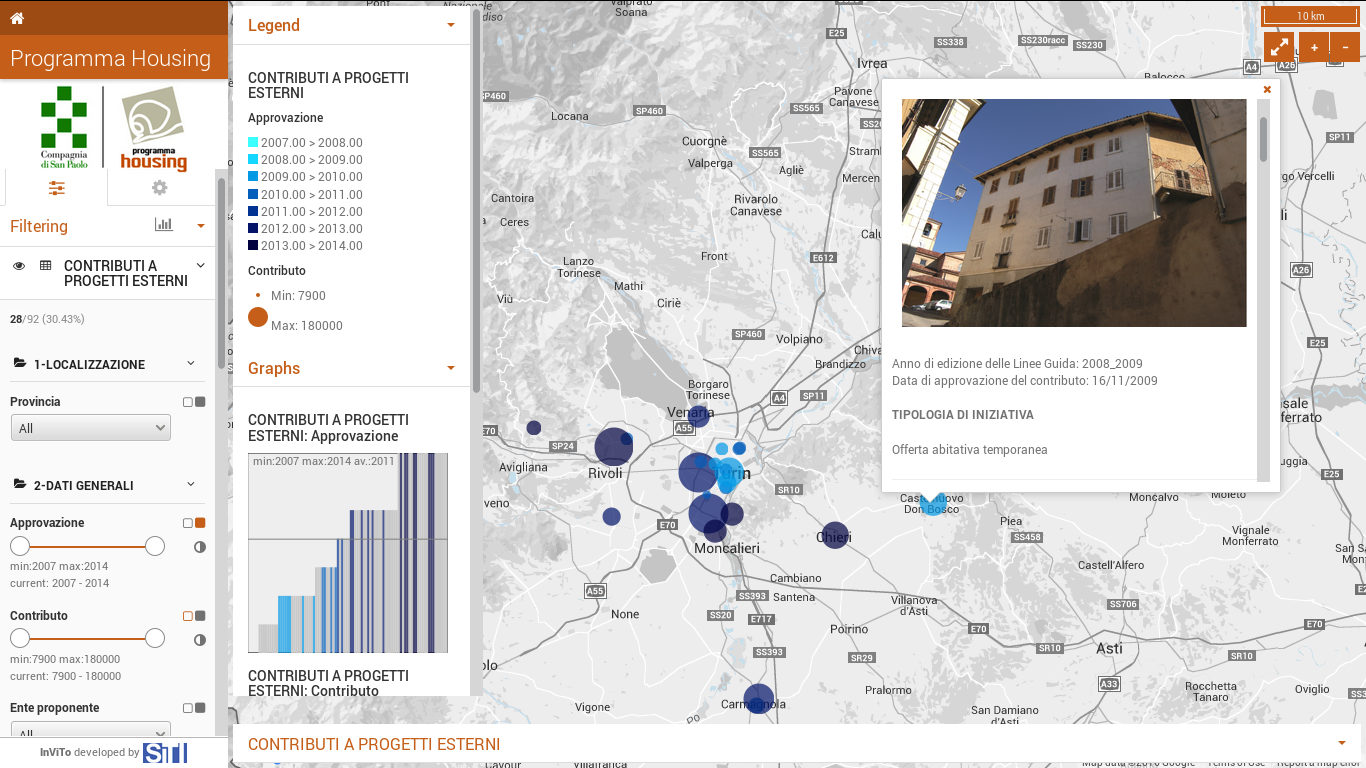
Programma Housing
Geodatabase for the initiative organized by Programma Housing of Compagnia di San Paolo since 2007.
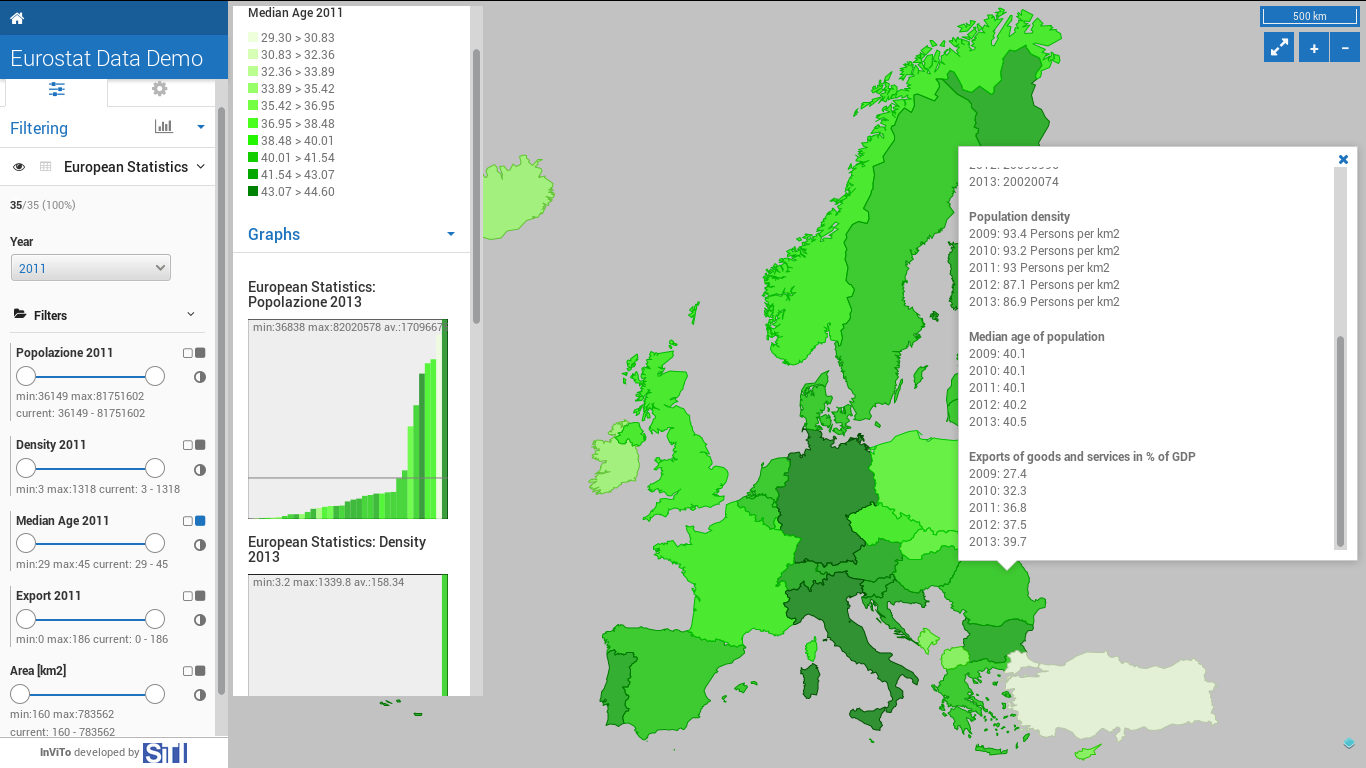
Eurostat
This demo shows a set of data collected from Eurostat website, the European Union statistical office, ec.europa.eu.
Features
InViTo is built to support the analysis, the exploration, the visualisation and communication of data in order to facilitate policy and decision-making, improve the communication between actors coming from different backgrounds.